P&ID vs Isometric Drawing
P&ID vs Isometric Drawing:- PID and piping isometric drawings both diagrams are used in process and chemical industries for the sake of representation of the processes of the plant and for training the operators and engineers about the plant and the processes.
Definition
A piping and instrumentation diagram (PID) is a detailed representation of the all the process equipments along with all the necessary representation of the all the instrumentation employed. It shows the proper interconnections between and their placements.
A piping isometric drawing is also a detailed diagram which is used to represent pipes, pipe fittings, bends, valves, welds etc. They are also commonly referred to as isos in process and chemical industries and in academics also.
Way of Representation
In PID, the equipments and the process control instruments are represented as two dimensional symbols. The interconnection between them is shown as a line. The transfer of materials from one equipment to another equipment is shown as a solid line. The pneumatic and electrical signals are shown as dashed and dotted lines. It does not give any information about the dept of the equipments or valves.
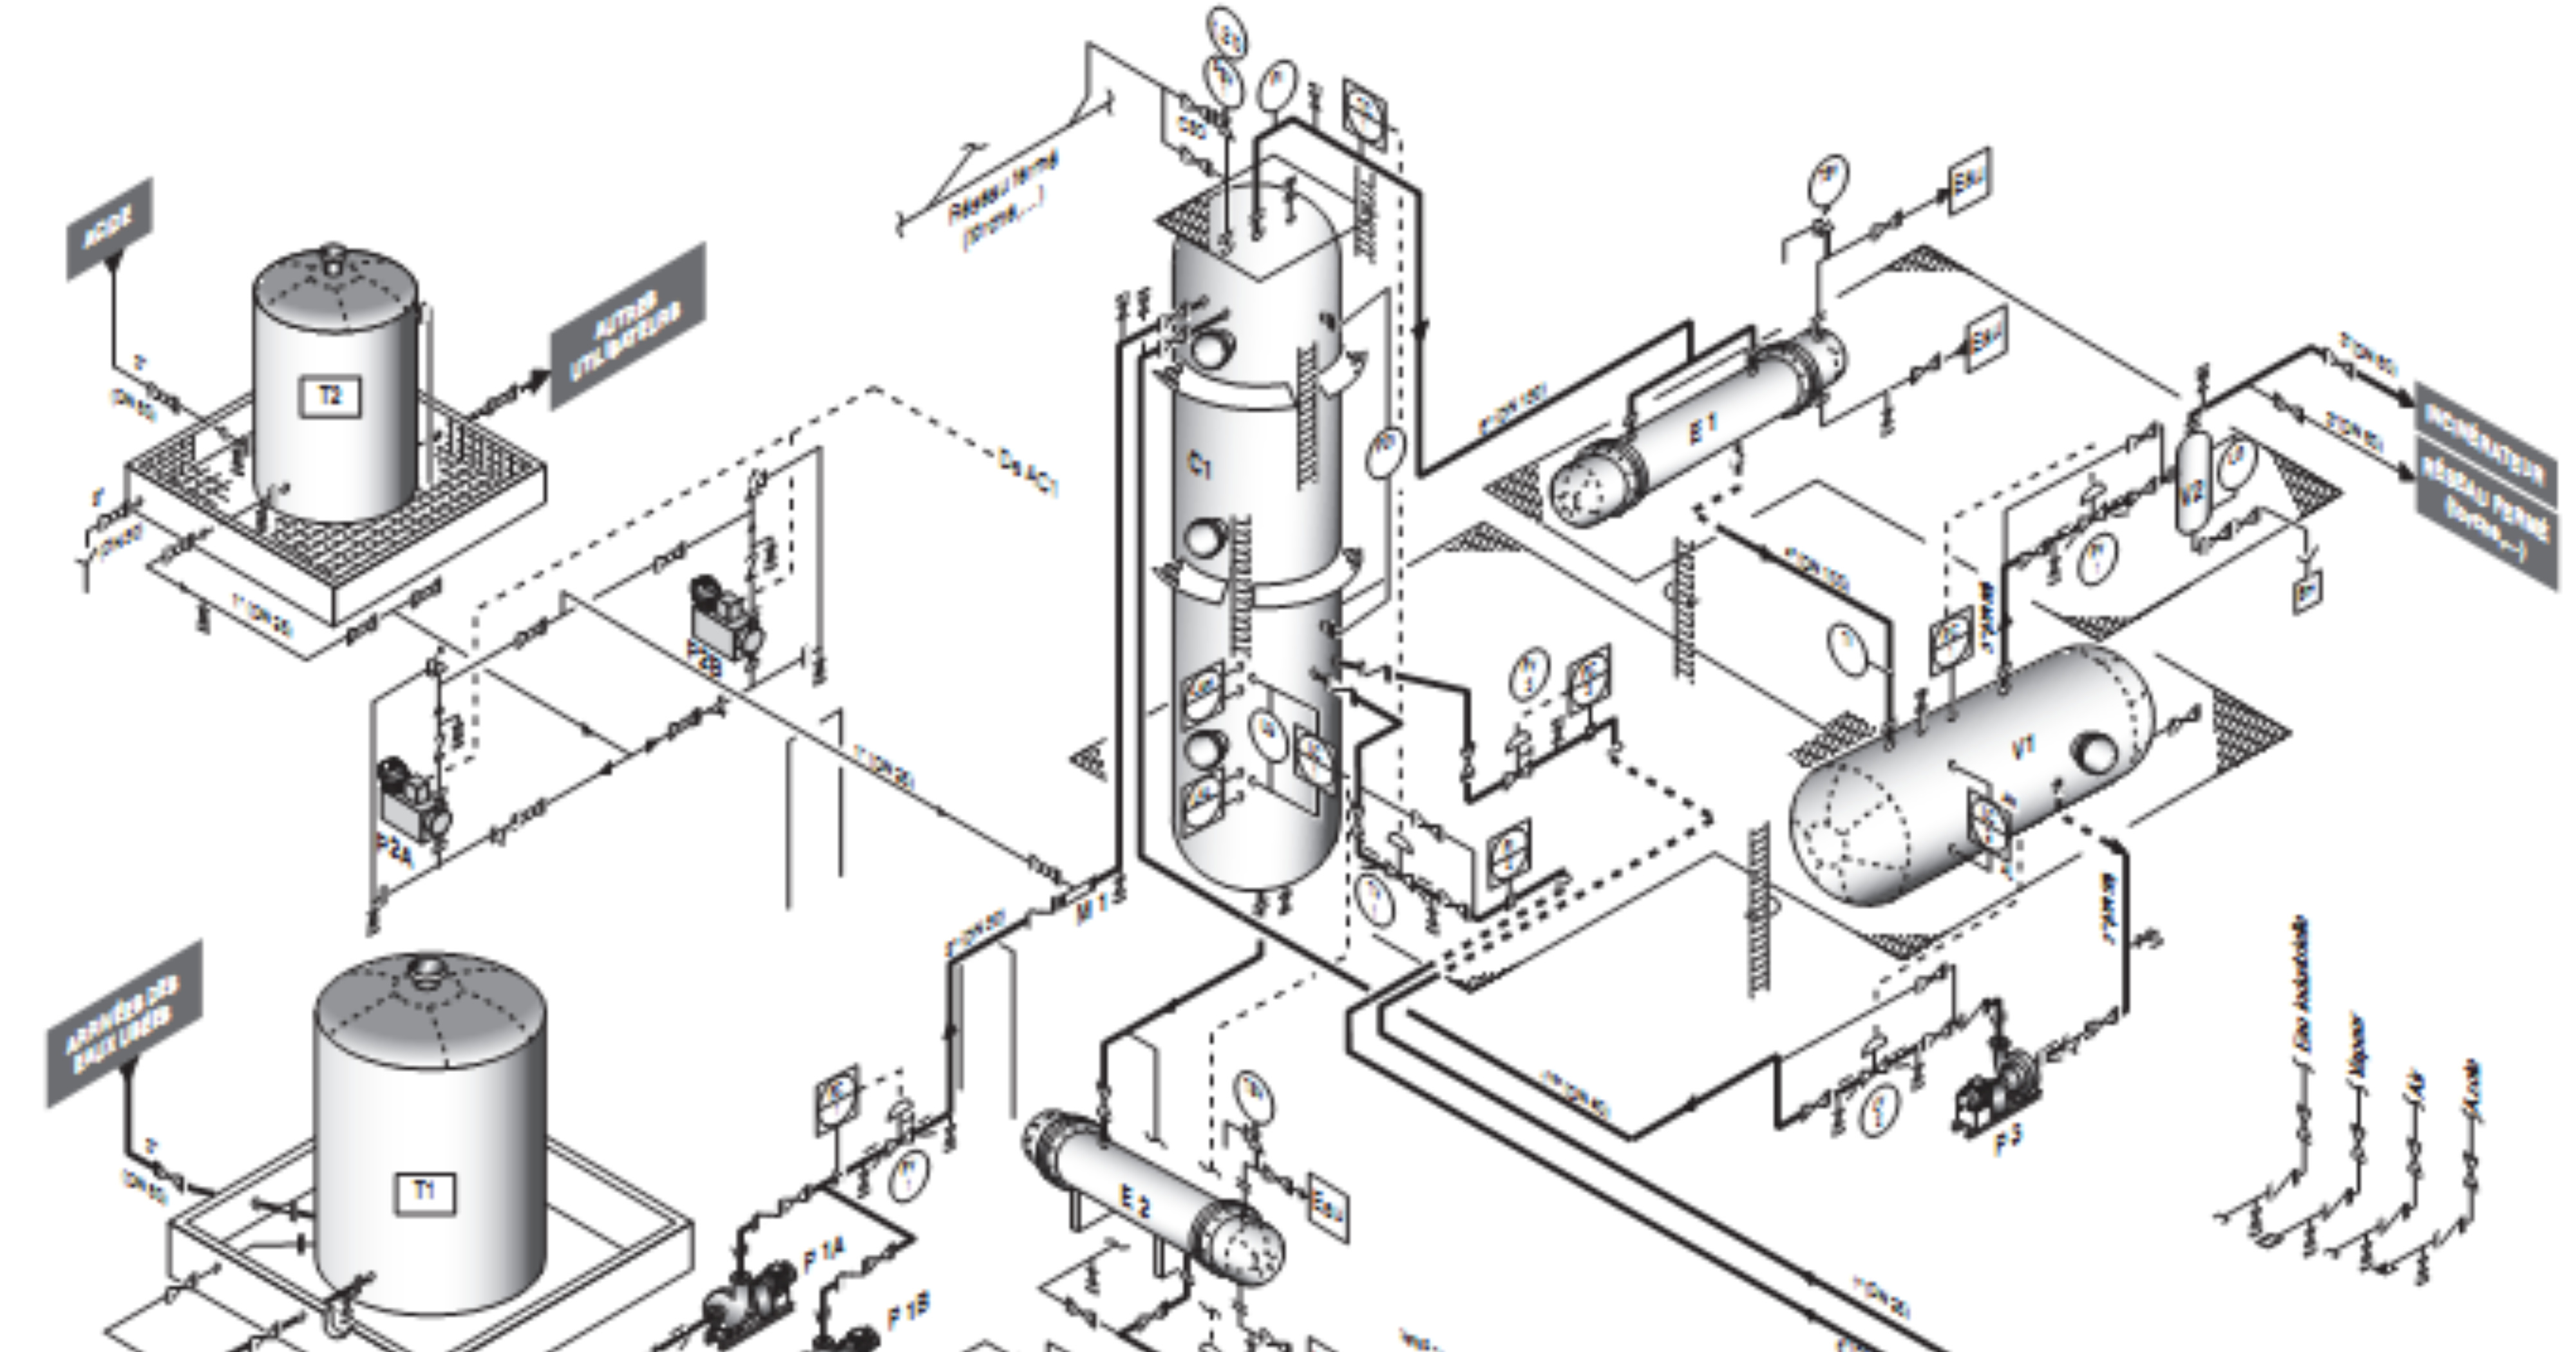
In Isos, the perception of depth is included; although it is a three dimensional representation but pipes are indicated as solid lines for simplicity and the bends are also represented as a combination of lines. The welds are represented as certain dots The pipe may bend in different directions, so the angle of change is also represented. Thus it is a three dimensional diagram on a two dimensional plane. They are drawn along lines of equilateral triangle of form of 60 degrees.
Primary use of the Diagrams
PIDs are primarily schematic used for laying out the process control installations.
Isos are used during the erection and installation process and also prior to stress analysis studies.
Reading the Diagrams
The symbolic representation of the equipments and instruments can be read by referring to legends. The most important part is the indicators, transmitter and controllers. The parameters which they control are represented by alphabets. If there are more than one instrument used for same purpose at different locations then they are numbered to differentiate between what number corresponds to which instrument.
The isos shows the direction of change of the pipe lines. It is read by locating the start point of the pipe line and then tracing the solid line and observing in what direction are they changing. The pipes may run up and down as north to south or south to north. They may move sideways also, like while tracing line the line may move east or west. Perception of depth and elevation is also relatively much clear to see. The pipe fittings are also represented symbolically as lines and welds are also visible, valves have a common distinct symbol so they are also easier to read.
Conclusion
Although the functions of both the diagrams are different when the process is large and complex both of them are required at all stages during erection and installations and after the process starts operating, these diagrams are also used for training operators and engineers.
Reference:- Automationforum. Wermac
Image:- Autodesk