Process Flow Diagram (PFD)
Process Flow Diagram (PFD)
Process Flow Diagram (PFD)
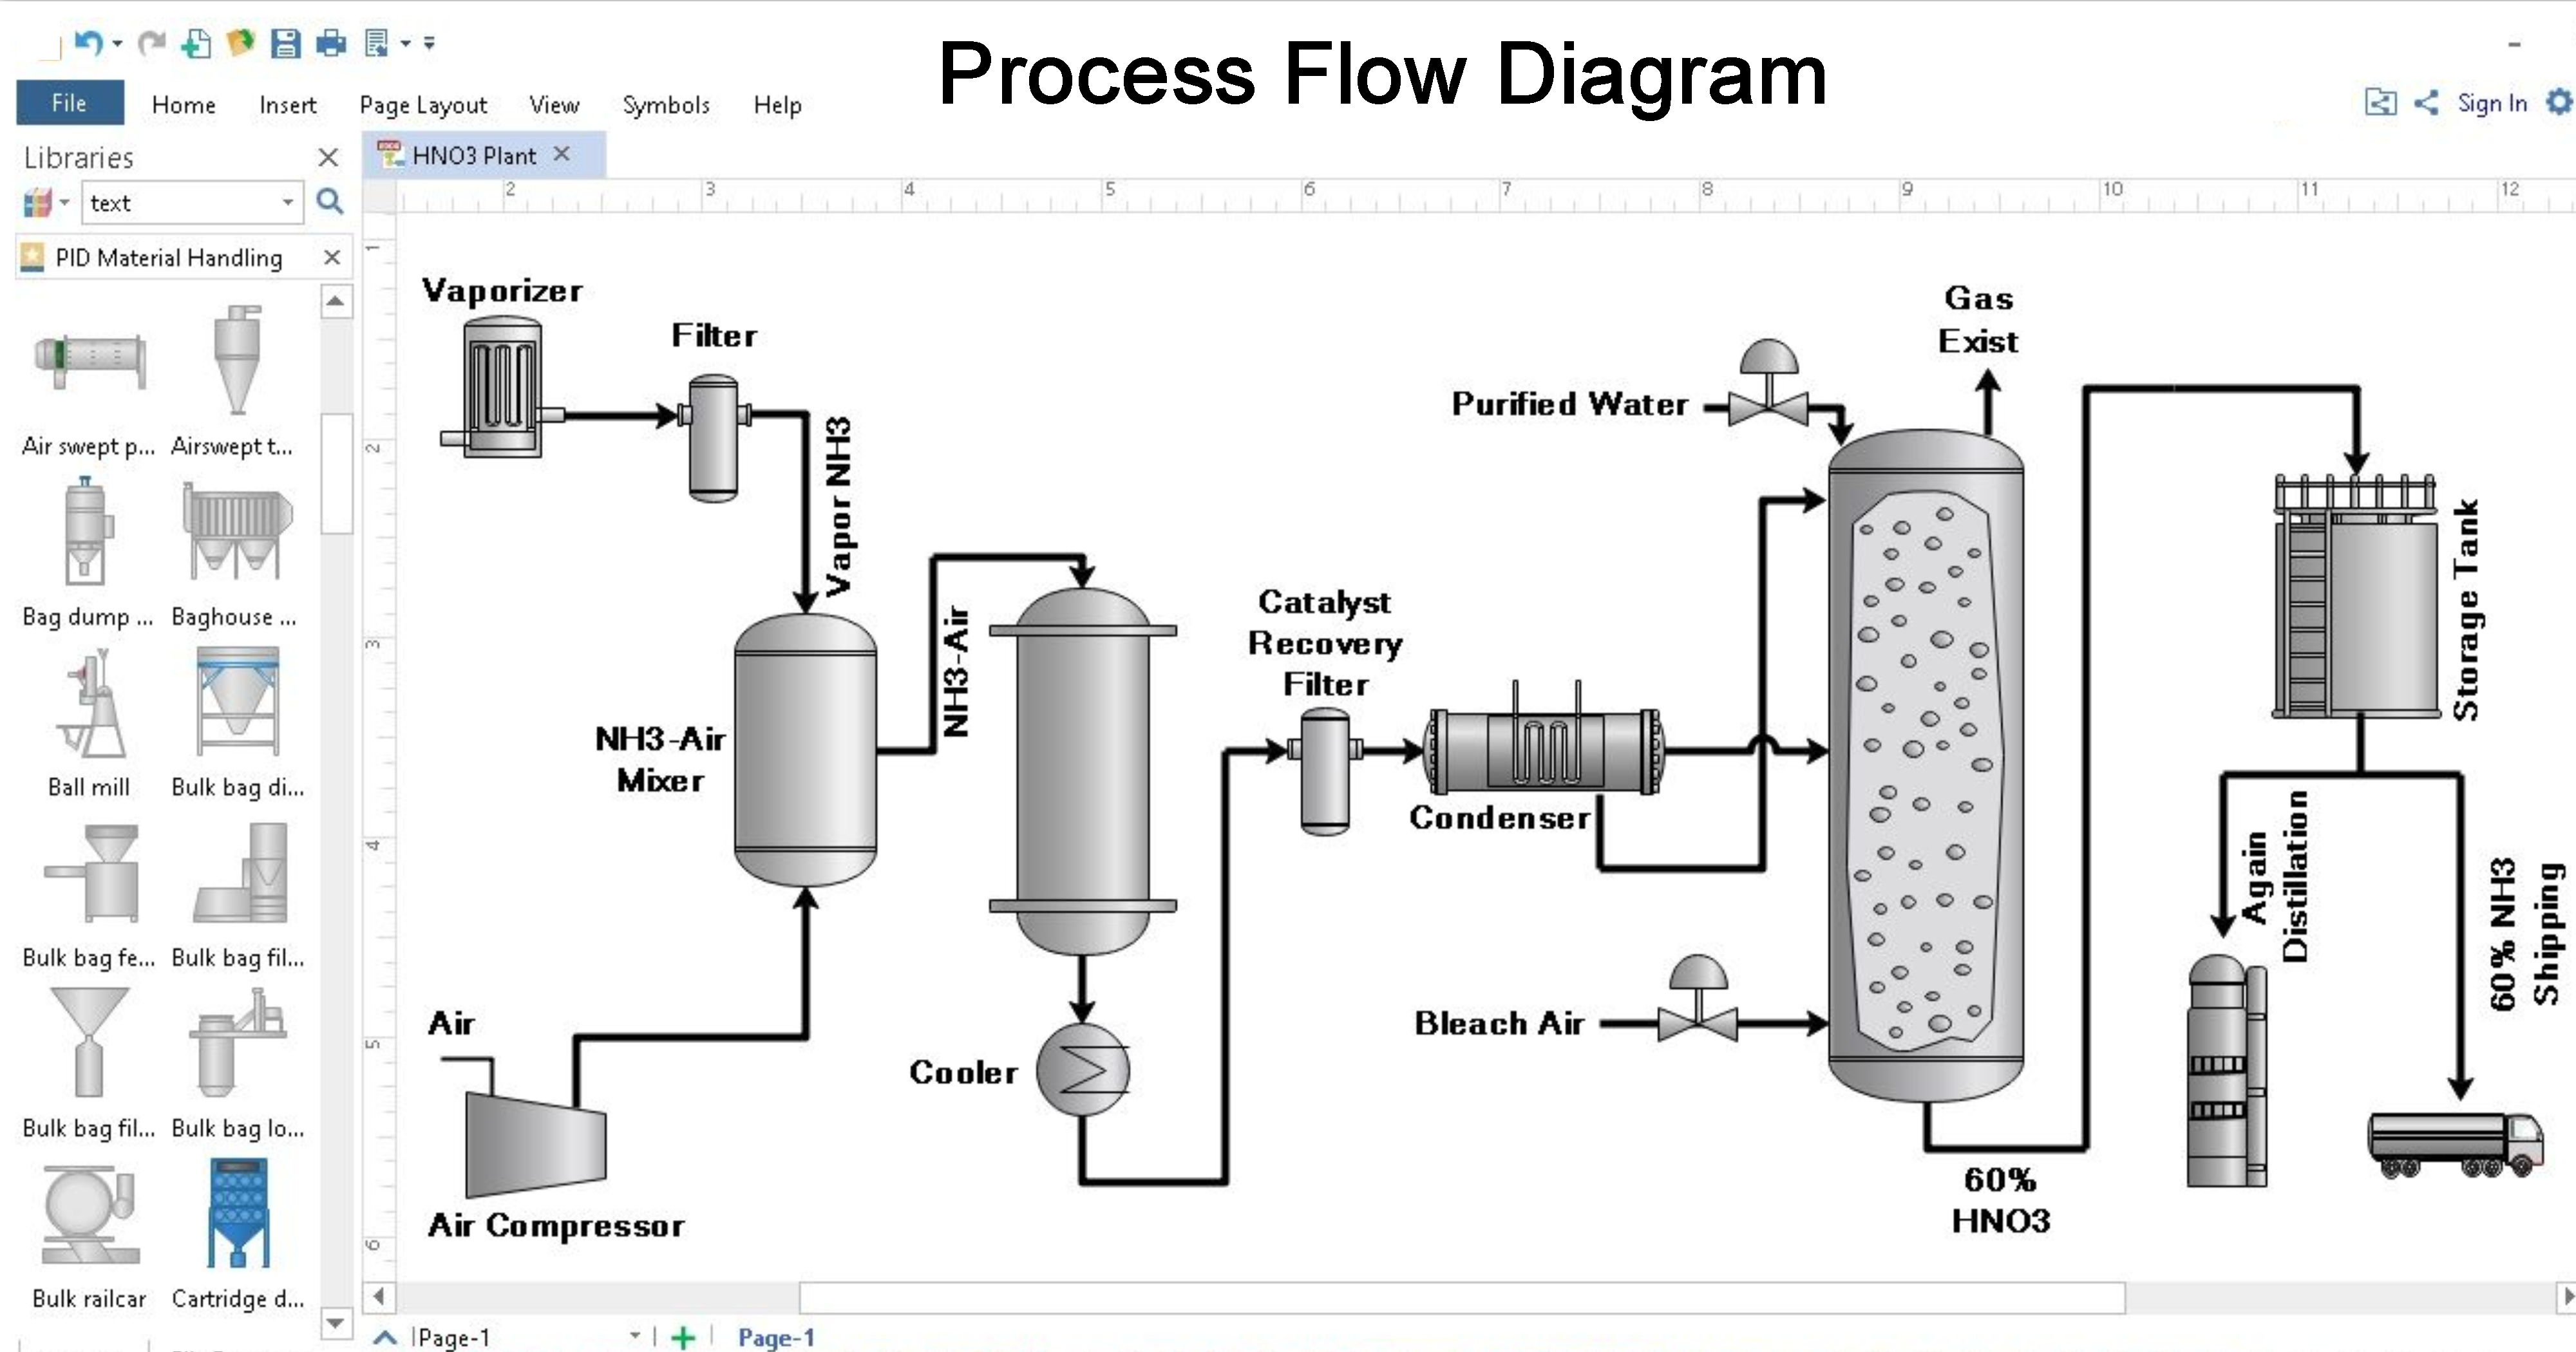
A process flow diagram (PFD) is a graphical representation of a chemical engineering process that shows the primary process flow path. It does not show the minor details of the process, rather it focuses on the equipment used, control valves and other instruments that are present. It helps to illustrate how the major components of a process plant interact with each other to bring about the desired effect. It is also effectively used in other sectors such as business administration to understand how different sections of a company can work efficiently in order to achieve their specific targets. Frank Gilbreth Sr. was the first person to develop a flow diagram in the year 1921, when he introduced it to the American Society of Mechanical Engineers (ASME).
The most important benefit of drawing a process flow diagram is that it gives the working personnel an overall view of the entire process taking place. This in turn helps them to make necessary improvements and changes wherever needed so that it is run at its maximum potential. Once all the changes are made, the process flow diagram acts as a standard to be followed by all people involved. This avoids confusion and also helps to prevent errors.
These flow diagrams may not always show the working of the whole plant. It may be used to represent different sections of a plant. This would help to understand more in detail about each specific operation that is being carried out, such as raw material storage, reaction, separation, purification, recovery and product storage. A typical PSD will contain operational data such as temperature, pressure and mass flow rates. Relief and safety valves are usually excluded from PSD whereas the control valves are critical components. Also keep in mind that these diagrams are not dimensionally in sync with the actual plant.
PFD symbols are a set of diagrams that show how different parts of the process are interconnected to each other. The symbols also depict the instrumentation devices that are used in the process. Examples of symbols include valves, pumps, compressors, reboilers and heat exchangers. Process lines represent the path through which the materials flow and are represented by various pipe symbols. There are also signal lines which are thinner than the process lines and they represent the kind of signal provided such as electronic or pnuematic signals. The commonly used symbols are prescribed by agencies such as ISO and ANSI.
Different kinds of process flow diagrams are used depending on the level of information and details that are required. A block flow diagram would show all the units that are present in the process but with very less details. The piping and instrumentation (P&ID) diagrams are more complex and include minor details such as equipment information, utility lines, bypass lines, drains and vents. P&IDs are developed on the basis of process flow diagrams only. The complexity of the PFD also varies depending on the level of details required by the personnel. The first section of the PFD should contain the legend sheet which shows the symbols and their names. This would be helpful for any person looking into it and helps to avoid confusion.
Reference:- lucidchart, visual-paradigm


